The Numbers That Should Concern Every Operations Leader
AMP8 has brought the UK water sector's operational workforce into sharp focus. Industry analysts estimate that delivering the £88 billion programme between 2025 and 2030 will require approximately 100,000 new operatives - a workforce scaling challenge of a magnitude the sector has never previously attempted. At the same time, AMP8's stated priorities place digitalisation and data-driven operations at the heart of how utilities are expected to deliver. The message from Ofwat is unambiguous: spending more is not enough. Spending smarter, with full visibility of how operational resource is being deployed and what it is achieving, is the new baseline expectation.
Yet for most water utilities today, the data that would give an operational director genuine visibility of field performance - productivity, health and safety, vehicle utilisation, team output - sits across three, four, or five disconnected systems. It is collected. It is stored. It is almost never synthesised into a single, coherent operational view. The result is a leadership team making decisions about resource deployment, performance management, and operational risk on the basis of incomplete information - and often not knowing it.
Fragmented Data, Fragmented Decisions
The operational data that water utilities generate every day is substantial. Job management systems capture task completion and workforce allocation. Fleet platforms track vehicle location and utilisation. Safety systems record near misses and training status. Workforce tools hold absence data and skills certifications.
Each system does its job. None of them talk to each other.
An operational director who wants to understand whether maintenance teams are performing efficiently, whether safety incidents are clustering in particular depots, or whether vehicle utilisation is constraining productivity - has to request reports from multiple teams, wait for manual assembly, and by the time they arrive, make decisions on data that is already days or weeks old. Research across field service-intensive industries consistently finds that managers overestimate team productivity, underestimate non-productive time, and have poor visibility of the leading indicators that precede safety incidents. Water utilities are not exempt - and in a sector where operational decisions carry direct regulatory consequences, that visibility gap is a material risk.
The Four Blind Spots Most Operational Directors Have
Understanding where the visibility gap actually lies is the starting point for addressing it. Across field operations in water utilities, four recurring blind spots tend to drive the greatest performance and risk exposure.
Productivity without context. Most utilities measure job completion rates. Far fewer measure what drives completion performance - travel time versus productive time, return visit rates, or output variation between equivalent teams. Without that context, productivity data tells you what happened but not why, and offers no lever for improvement.
Lagging safety indicators. Health and safety reporting is typically incident-led - it captures what went wrong. The leading indicators that predict where incidents are most likely - near miss frequency, overdue certifications, extended consecutive shifts, high-risk task concentrations - are rarely visible in real time. By the time a pattern appears in incident data, preventable harm has already occurred.
Vehicle utilisation as a hidden cost driver. Fleet data exists in most utilities but rarely reaches operational leadership in a form that connects vehicle utilisation to field output. The relationship between fleet availability, scheduling efficiency, and productivity is one of the most significant and least examined cost drivers in maintenance operations.
Team performance variation at local level. Aggregate data masks the local variation that matters most. A utility whose overall productivity looks acceptable may have two or three depots significantly underperforming - and others significantly overperforming in ways that hold lessons for the wider operation. Without depot-level drill-down in a single view, that variation stays invisible.
What a Unified Operational Dashboard Changes
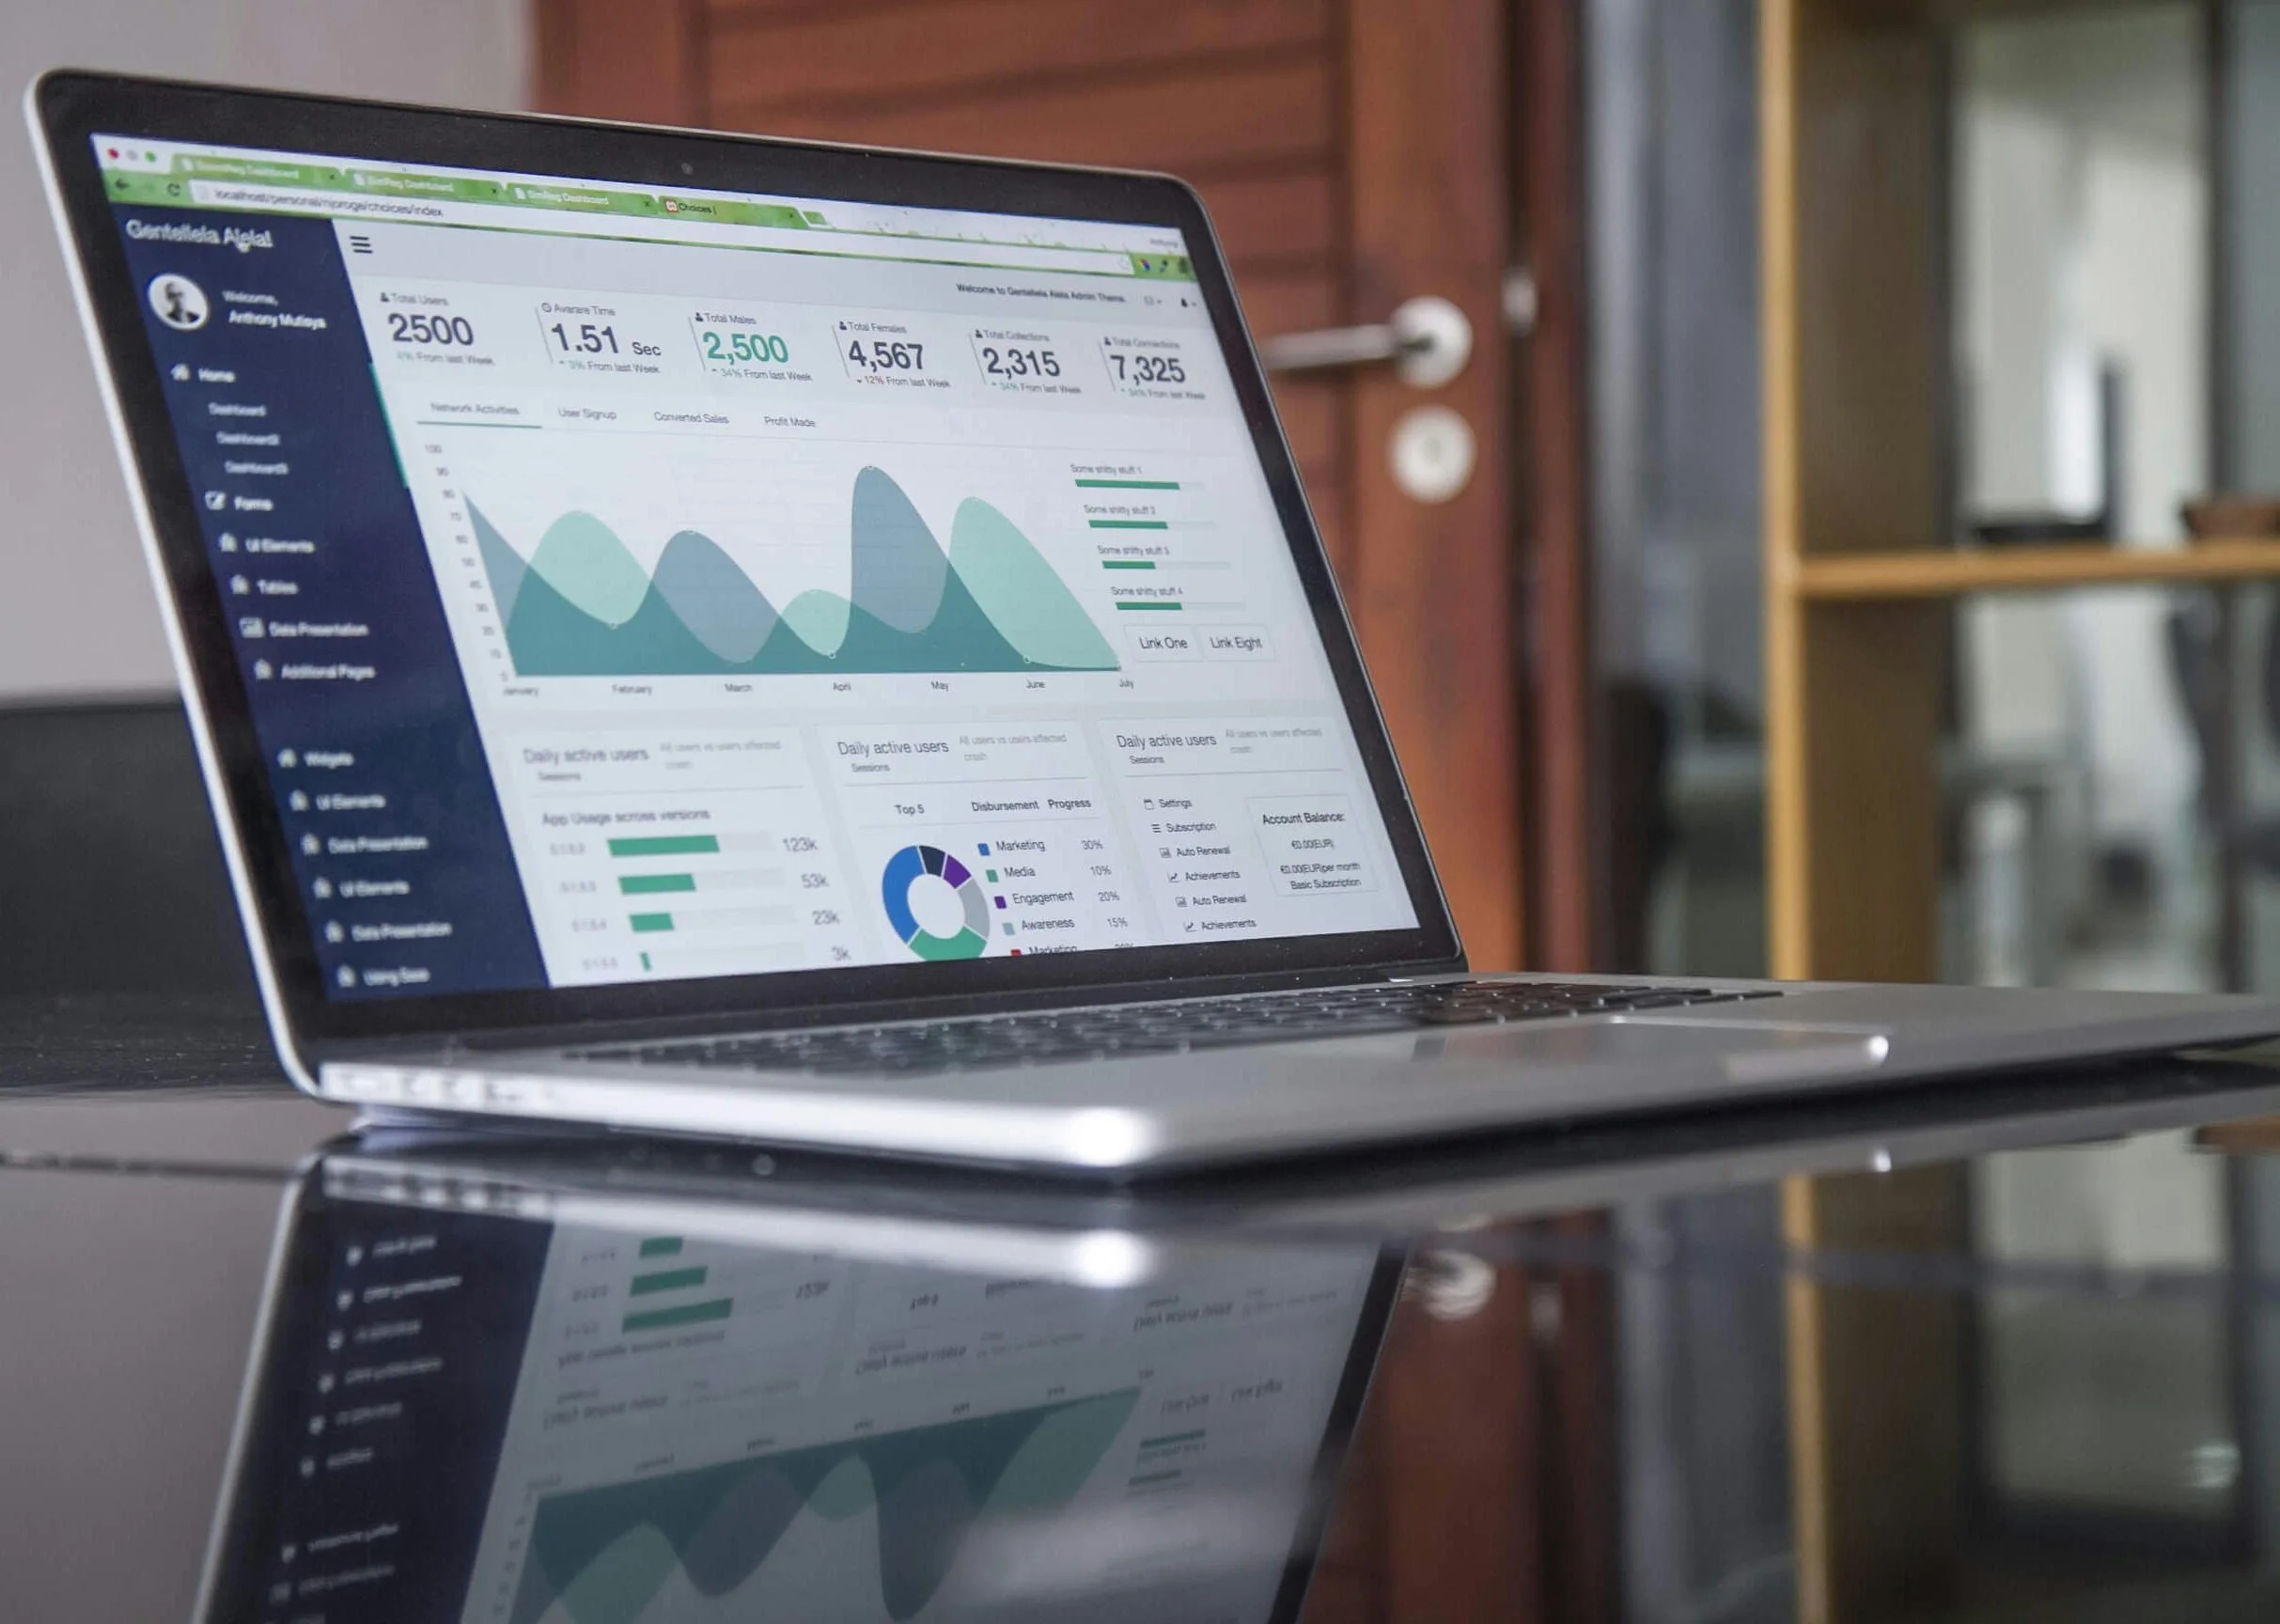
An operational maintenance performance dashboard does not create new data. It connects the data that already exists - job management, fleet, safety, workforce - into a single, unified operational view that is accessible to the right people at the right level of the organisation.
For an operational director, that means a real-time picture of productivity against targets, safety indicators trending in the right or wrong direction, and local performance variation significant enough to warrant intervention - not a static report assembled weekly, but a live operational instrument updated continuously as field data flows in.
For a depot manager, it means local accountability grounded in data, with the ability to act without waiting for a reporting cycle. For a safety team, it means early warning of the conditions that precede incidents rather than a record of the incidents themselves.
Organisations that replace fragmented, lagging performance data with unified real-time visibility consistently find improvements in field productivity, reductions in non-productive time, faster resolution of local performance issues, and better safety outcomes from leading rather than lagging indicators.
AMP8: The Operational Visibility Imperative
The scale of AMP8 makes unified operational visibility not just desirable but necessary. Delivering a programme four times larger than its predecessor - with approximately 100,000 new operatives entering the sector by 2030 - requires a quality of real-time performance insight that the sector has historically not prioritised.
AMP8 explicitly identifies digitalisation and data-driven operations as a core delivery priority, not as a technology aspiration but as a practical requirement for managing the programme efficiently. Utilities that enter the period with fragmented operational data and manual reporting will face a compounding disadvantage as the programme scales. The utilities that deliver most effectively will be those whose operational leadership can see, in real time, whether teams are performing, assets are being maintained efficiently, and safety risk is being managed proactively.
How VE3 Delivers It
Our approach to operational maintenance performance dashboards is built on the same principle that runs through all of our data work: connect what exists before building what is new.
Our Discovery Diagnostic - two to three weeks - maps the operational data landscape: job management systems, fleet platforms, safety reporting tools, and workforce management data. It identifies where the data is, what quality it is in, and which operational questions it can and cannot currently answer. The output is a clear picture of the integration architecture needed and the dashboard priorities that will deliver the greatest immediate value to operational leadership.
The Focused Delivery phase - eight to ten weeks - builds and deploys the unified dashboard, connecting the relevant data sources and delivering a live operational view calibrated to the specific reporting needs of operational directors, depot managers, and safety teams. Deployment is within the utility's existing security and governance framework.
From there, the Scale and Expand phase extends coverage and integrates the operational performance layer with wider data programmes - asset management, predictive maintenance, and network intelligence - so that operational performance data becomes part of a broader picture of how the business is running, not a standalone reporting exercise.
Our experience working with Water bodies on operational and asset data consolidation gives us direct reference points for the system complexity, data quality challenges, and operational change management that unified dashboard deployments require in practice.
Visibility Is Not a Luxury. It Is a Leadership Requirement.
The most experienced operational director in the water sector cannot manage what they cannot see. Field teams working across dispersed geographies, multiple depots, and a wide range of task types generate a volume and complexity of performance data that no reporting process built on manual assembly and weekly cycles can synthesise effectively.
The data to run operations better already exists. The question is whether it is connected, visible, and actionable - or whether it is sitting in four separate systems, waiting to be requested, assembled, and delivered too late to matter.
In an AMP8 environment where operational delivery at scale is both a commercial and regulatory imperative, that question has a clear answer.
VE3 Global is a UK-based technology consultancy specialising in AI, data, and digital transformation across regulated industries, including water utilities. Our operational intelligence solutions are designed for the performance management, safety, and delivery demands of AMP8 and beyond.
To discuss how a unified operational performance dashboard could improve visibility and control across your maintenance operations, speak to our utilities practice.