By Adam Slack, Head of Engineering at Nimble Approach
This is the first of three articles bringing together ideas from public research, open-source projects, vendor documentation and established data-engineering practice.
It is intended as a quick primer for anyone unfamiliar with context graphs, or unsure how they relate to knowledge graphs, GraphRAG and agent memory. The next two articles will move into the architecture: how context can be organised around the way people work, and how data is copied, synchronised or retrieved when needed.
I began by looking at tools: Neo4j, its Create Context Graph project, AWS Neptune, GraphRAG implementations, PydanticAI and several agent frameworks.
I expected the choice of graph database to dominate the work. In practice, most of the difficult questions sat around it:
- How much data should be copied?
- What should remain in its source system?
- How fresh does the graph need to be?
- Should the whole organisation share a graph?
- Do teams, users and agents need smaller views?
- Where should generated summaries, inferences and analysis be stored?
These are familiar architecture and data-engineering questions. AI introduces new ways of consuming information, and some demanding usage patterns, but the underlying concerns include data movement, ownership, lineage, access control, caching and consistency — the same concerns that shape data platforms for the AI era and governance for enterprise AI.
Before working through those decisions, it helps to establish some common language. Knowledge graphs, context graphs, GraphRAG and agent memory are closely related, but they describe different parts of a system.
Knowledge Graphs
A knowledge graph represents entities and the relationships between them.
An enterprise graph might contain customers, employees, teams, applications, documents, assets and incidents. Its value comes from expressing how those things connect:
- A team owns an application.
- An application depends on a service.
- A customer uses a product.
- An incident affected an asset.
- A document records a decision.
- An employee worked on a project.
Knowledge graphs have been used in search, recommendations, fraud detection, life sciences and information management for years. Their current association with generative AI can make them sound newer than they are.
For this series, I’ll use knowledge graph to describe the longer-lived representation of an organisation or domain.
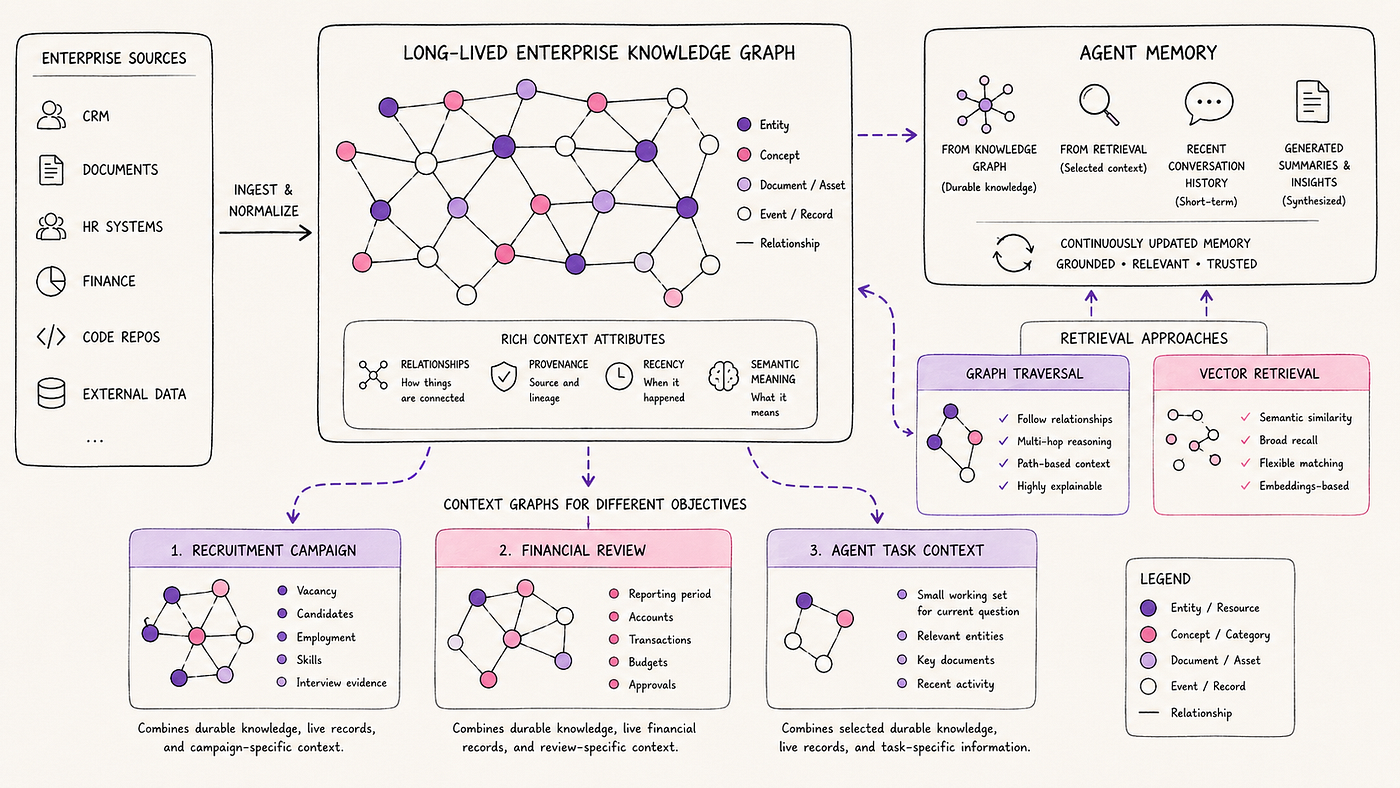
That does not mean the graph owns every record. The CRM may remain the source of truth for a customer, while the asset management system remains authoritative for an asset. The graph provides a connected view across those systems — closer to curated organisational context than to a dump of every warehouse table into a model.
Context Graphs
I use context graph to describe a purpose-driven view of connected knowledge assembled for a particular objective.
It may draw from a wider knowledge graph, live source systems, recent activity and task-specific information. The context could belong to a department, programme, customer, operation, investigation, user or AI agent.
It contains the entities, relationships and supporting information needed for a particular objective.
A context graph could be implemented in several ways:
- A physical subset copied into another graph
- A logical view over a shared graph
- A temporary graph assembled when needed
- A query layer spanning several systems
The role it performs matters more than the implementation.
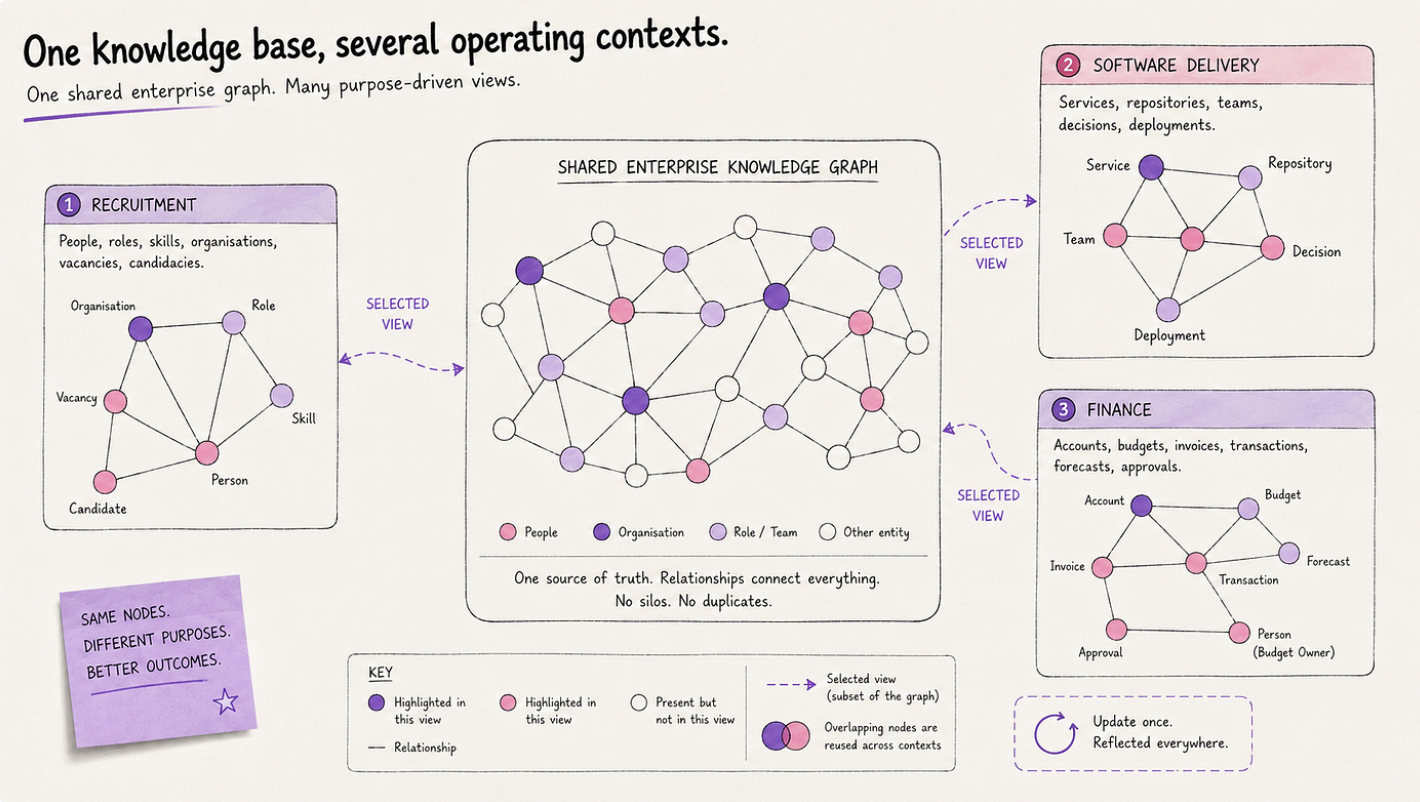
A recruitment context might bring together an open role, required capabilities, candidates, previous employment, interview notes and evidence against the role.
A finance context might focus on a reporting period, accounts, transactions, invoices, budgets, approvals and the people responsible for resolving exceptions — the kind of cross-system assembly that shows up repeatedly in FinTech operations.
Each draws from a wider pool of organisational knowledge and is shaped by the work being done.
Some information may only be useful for a few hours. Other parts may later become durable organisational knowledge. Verified evidence that a candidate used a skill in a previous role might remain useful beyond the current vacancy. A temporary comparison score probably should not.
This is the definition I’ll use throughout the series:
A context graph is a purpose-driven view of connected knowledge, assembled from durable organisational knowledge, live sources and task-specific information to support a particular operating context or objective.
I’m treating this as a practical working definition rather than an attempt to create a formal standard.
Agent Memory
Agent memory describes how an AI system retains and recalls information over time.
A graph may support that memory alongside several other mechanisms:
- Recent conversation history
- Generated summaries
- Vector search
- Relational databases
- Files
- Key-value stores
- Knowledge and context graphs
A software engineering agent might keep the recent conversation directly in its prompt, use vector search to find relevant architecture documents, and query a graph to identify the services and teams connected to a deployment.
The agent’s memory is the combined capability. The graph contributes connected knowledge where relationships are useful. That sits squarely inside what we call the agentic harness: memory and retrieval are product architecture, not a model feature. It is also how multi-agent systems share durable context across planners and workers.
GraphRAG
GraphRAG uses graph structure as part of retrieval-augmented generation.
A conventional RAG system often retrieves passages based on semantic similarity. A GraphRAG approach can also retrieve entities, paths, communities and connected records.
A question about a failed service could lead the system towards:
- The service itself
- Its dependencies
- Recent deployments
- Related incidents
- The owning team
- Previous architectural decisions
That pattern is especially familiar in cyber security, where incident response depends on correlating assets, services, ownership and prior decisions at speed.
Different GraphRAG implementations do different things. Some extract entities and relationships from documents to create a graph. Others query an existing organisational graph. Some combine graph traversal with vector search.
It is worth checking what a particular tool builds, where the graph is stored and how it is maintained. The label alone does not answer those questions.
Vector Stores
Vector stores help locate information that is similar in meaning.
They are useful when a system needs to find relevant documents or passages despite differences in wording. Graphs add value where the relationships between records need to be followed.
In an engineering scenario, vector search might find an architecture decision discussing authentication. A graph could then identify the affected services, their dependencies, their owners and the incidents linked to them.
Many practical systems will combine retrieval methods rather than relying on one — the same mixed-stack approach we see when building agentic applications on data platforms.
Ontologies
An ontology describes the concepts and relationships within a domain.
It may define:
- What counts as an asset
- The types of incident the organisation recognises
- How services can depend on one another
- Which relationships can exist between teams, people and systems
- What those relationships mean
The ontology provides a shared structure for the graph.
It can be formally governed and highly detailed, or relatively lightweight. The appropriate level depends on the domain, the questions being asked and the consequences of ambiguity — and it is one of the places governance has to be designed in, not bolted on later.
Why Add a Graph at All?
Enterprise questions frequently span several systems.
A hiring decision may involve a job description, candidate CVs, previous employment, interview notes, references and evidence against the role’s requirements.
A finance question may involve ledger entries, invoices, contracts, budgets, forecasts, approvals and the people responsible for resolving an exception.
Experienced people build these connections mentally. They know where to look, which records matter and how one system relates to another.
A graph makes some of those relationships available to software.
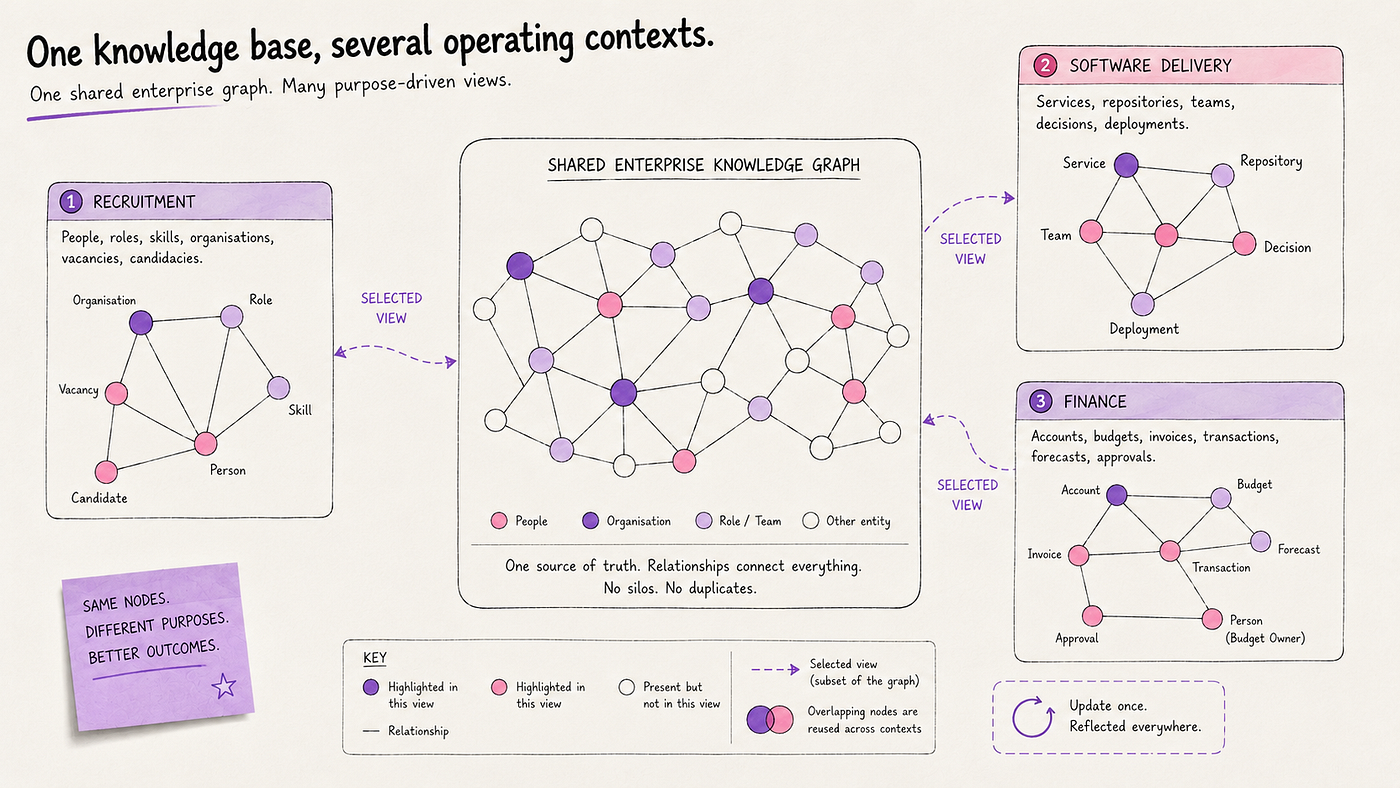
In recruitment, an organisation may hold information about people, roles, skills, vacancies, organisations and candidacies. A hiring team reviewing one vacancy needs a focused view of the relevant candidates, their experience, supporting evidence and current assessment.
In finance, a month-end close may need a different working set: the accounts in scope, unresolved variances, related transactions, invoices, approvals and accountable owners.
The underlying organisational data may support many activities. The objective determines which part becomes useful context — which is why less, better-curated context usually outperforms “give the model everything.”
The Questions Move Beyond the Graph
Once a graph begins supporting real work, several architecture decisions appear quickly.
- Does a context graph exist for the whole organisation, a department, an operational programme or an individual investigation?
- Is it a stored subset, a logical view or something built temporarily?
- How long should it exist?
- How frequently will it be used?
- How quickly must changes appear?
- How should information created during the work make its way back into the wider organisation?
These decisions depend heavily on the organisation’s operating model. Departments, programmes, operations, investigations, incidents and individual tasks all create different boundaries around useful context. They also sit inside our philosophy: humans set intent and boundaries; agents execute within an architecture that makes those boundaries enforceable.
The second article in this series looks at those boundaries through three dimensions:
- Scope: how much of the organisation or domain the context covers
- Lifetime: how long the context remains useful
- Temperature: how likely the information is to be needed for current reasoning
That leads into the idea of Context Temperature, borrowed from the established data-engineering concept of hot, warm and cold data.
It also helps explain why one large graph is unlikely to be the right working surface for every team, user and agent — across FinTech, cyber, utilities, and the other sectors where connected organisational knowledge is the difference between a demo and a dependable system.
If you are designing graph-backed memory or retrieval for agentic workflows, get in touch.