By Adam Slack, Head of Engineering at Nimble Approach
Scope, lifetime and Context Temperature
In the first article in this series, I drew a line between context graphs and related topics such as knowledge graphs, GraphRAG and agent memory.
This article focuses on three key concepts for designing context-graph-based systems, with the application of data temperature to context graphs being especially interesting.
The definition for context graphs I settled on was:
A context graph is a purpose-driven view of connected knowledge, assembled from durable organisational knowledge, live sources and task-specific information to support a particular operating context or objective.
That leaves an architectural question: what should define the boundary of that context?
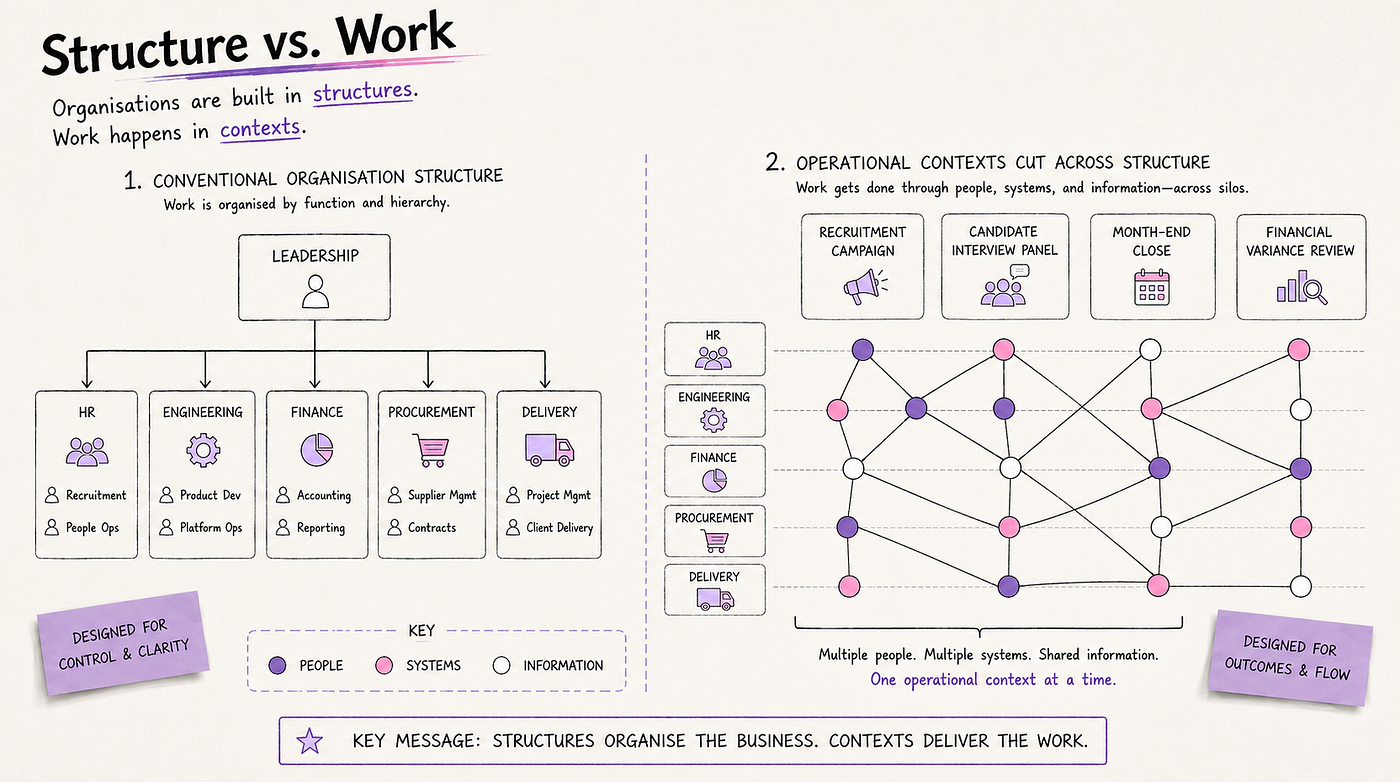
Following the organisation chart is one option. Engineering gets one graph, sales gets another, operations gets another.
That may suit some organisations, but it describes where people sit rather than how work happens.
Most organisations already divide work into smaller operational units:
- Programmes
- Products
- Customers
- Cases
- Incidents
- Campaigns
- Investigations
- Projects
- Tasks
These boundaries are a better starting point for context graphs than departments or source systems — and they align with how we think about curated organisational context: the useful working set follows the objective, not the warehouse.
A recruitment campaign can involve hiring managers, HR, engineering leadership and interviewers from several teams. A month-end close can involve finance, procurement, delivery teams and budget owners.
The people involved may sit in different parts of the organisation. They still need a shared view of the work.
Graph Layers as Operational Subsets
It is tempting to picture a hierarchy of graphs as a purely technical architecture consisting of graphs that are subsets of others.
That is useful up to a point, although the labels can be misleading.
A department-level graph is really a graph for a particular operating model. In another domain, the equivalent layer might be a campaign, a major programme, a business unit or a customer account.
The next layer could represent a product team, an incident response group, a case-working team or an investigation.
The hierarchy describes increasingly focused working contexts. Each layer draws from the wider one:
- The operational context selects the people, systems, assets, events and objectives relevant to a body of work.
- The team or investigation context narrows that further.
- The task context focuses on the immediate decision or action.
- Agent memory holds the information needed during the current interaction or workflow.
These layers do not need to be separate graph databases. They may be views, labels, filtered traversals, temporary sub-graphs or materialised copies. Scale, security, access patterns and tooling will influence the implementation — the same data-platform choices that determine what is copied, cached or left in source systems.
Example Context Layers: Software delivery
Assuming most readers are working in software engineering — what are all the “things” and relationships you might be interested in knowing about, or getting an update on?
An enterprise graph for a software engineering business may contain information describing:
- Applications
- Teams
- Repositories
- Cloud resources
- Suppliers
- Architecture decisions
- Incidents
- Deployments
A programme context may select the services, teams and dependencies involved in a transformation.
A team context may focus on one product and its supporting systems.
An incident context may contain a much smaller set of deployments, alerts, dependencies and recent decisions.
An agent helping with the incident may only need part of that again — a pattern familiar in cyber security operations, where correlation has to be fast and tightly scoped.
Example Context Layers: Recruitment
Think about an engineering leadership recruitment process.
The enterprise layer may include:
- People
- Roles
- Skills
- Organisations
- Vacancies
- Candidacies
- Interview notes
- Hiring decisions
A broader operational context could represent one hiring campaign.
That campaign may only need the vacancy, its requirements, the hiring team, active candidates and the evidence collected so far.
A candidate review narrows the context again. It might include:
- Previous roles and organisations
- Skills evidenced through employment
- Relevant interview notes
- Gaps against the vacancy requirements
- Current candidacy status
- Relationships to existing employees or interviewers
Interview preparation may use a smaller working set containing the evidence already available, the areas that still need exploring and the questions assigned to each interviewer.
Enterprise "People and Hiring" Knowledge
        ↓
Hiring Campaign
        ↓
Candidate Review
        ↓
Interview Preparation
        ↓
Agent Working Memory
The same candidate may appear in several campaigns over time. The wider recruitment graph can retain durable employment and skills evidence, while each campaign assembles the context needed for its particular vacancy.
Example Context Layers: Finance Operations
An organisation may hold information about:
- Accounts
- Business units
- Budgets
- Transactions
- Invoices
- Suppliers
- Contracts
- Approvals
- Forecasts
- Reporting periods
A broader operational context could represent a month-end close, annual planning cycle or reporting period — the kind of cross-system assembly that shows up repeatedly in FinTech.
Within that context, a finance team may create a narrower review around one material variance, unreconciled account or group of related transactions.
Enterprise Finance Knowledge
        ↓
Reporting Cycle
        ↓
Variance Review
        ↓
Analyst Task
        ↓
Agent Working Memory
The reporting-cycle layer brings together the accounts, budgets, deadlines and owners relevant to the period.
The variance-review layer is narrower. It may contain the account, related transactions, invoices, previous forecast, approvals and the people responsible for resolving the issue.
The same analyst may move between several reviews during a reporting cycle. Their role remains the same, while the useful context changes with each question.
A permanent graph organised around the individual analyst would be too broad. The objective provides a more useful boundary.
Three Dimensions of Context
Hierarchy alone does not describe the whole problem.
Two graphs at the same organisational level can have very different requirements.
- A customer account graph may exist for years and be consulted occasionally.
- An incident graph may exist for four hours and be queried constantly.
- A legal matter may last for months while remaining tightly isolated from every other case.
I have found it useful to describe context using three dimensions:
- Context Scope
- Context Lifetime
- Context Temperature
They influence different parts of the architecture — including how you design the agentic harness around memory, retrieval and access control.
Scope
Scope describes how much of the organisation or domain the context covers.
It may be:
- Enterprise-wide
- Domain-specific
- Programme or campaign-level
- Team-level
- Customer or case-specific
- Task-specific
Wider scope gives the graph more potential connections. It also increases noise, cost and the difficulty of applying access controls.
Smaller scope makes the graph easier to reason over, although useful relationships may sit just outside the boundary.
The right boundary usually follows the work.
A customer support agent needs enough organisational context to understand the customer’s products, contract, history and current issues. They probably do not need unrelated customers.
A recruitment review may begin with one vacancy, then expand to include candidates, previous employment, supporting evidence and interview notes.
A finance review may begin with one unexplained variance, then widen to related accounts, transactions, invoices, contracts and accountable owners.
Scope can widen or contract as the objective changes.
Lifetime
Lifetime describes how long the context remains useful.
Some graphs are effectively permanent.
An enterprise knowledge graph may evolve over many years. A customer account graph may remain useful throughout the commercial relationship.
Other contexts are temporary:
- A software incident graph may exist for the duration of an outage.
- A hiring campaign may remain active for several weeks or months.
- An interview-preparation context may only be useful for a few days.
A month-end close is short-lived and intensive, while a financial-planning context may evolve across an entire year. A task graph may last for a single agent run, or for hundreds.
Lifetime affects several practical decisions:
- Whether the graph should be persisted
- How much effort should go into validation
- Whether temporary inferences should be retained
- How access is revoked
- When data should be archived or removed
- How much history is required
A long-lived graph needs stronger governance. Poor entity resolution or incorrect relationships become more damaging over time.
A short-lived graph can tolerate more disposable material, provided it is clearly separated from trusted organisational knowledge.
Context Temperature
Data engineering has long used the idea of hot, warm and cold data.
Hot data is accessed frequently and often needs low-latency storage. Cold data is rarely used and can sit in cheaper archival systems.
I find it useful to apply a similar model to context.
Context Temperature describes how likely a piece of information is to be useful to current reasoning.
It does not describe how important the information is.
A ten-year-old safety incident may be extremely important. It can still be cold context if it is rarely needed.
A fairly routine security event may become hot when it is connected to an active investigation.
A simple working model might be:
Hot context
- The current candidate review
- Interview notes for an active vacancy
- Open actions in a month-end close
- An unresolved financial variance
- Recent agent actions
- Current hypotheses and decisions
Warm context
- Role definitions and required capabilities
- Recent candidate evidence
- Current budgets and forecasts
- Account ownership
- Supplier and contract information
- Programme dependencies
Cold context
- Closed recruitment campaigns
- Previous interview outcomes
- Earlier reporting periods
- Superseded forecasts
- Historical adjustments
- Past project decisions
Frozen context
- Archived application exports
- Detailed historical transaction data
- Long-term reporting archives
- Raw operational event data
- Old document versions
Frozen context can often remain in the lakehouse, archive or original source system until something makes it relevant.
Temperature changes
A previous candidate record may become hot when a similar vacancy opens.
Historical transactions may become hot when a current variance points back to an earlier adjustment.
A recruitment assistant reviewing one vacancy should not receive interview notes from unrelated hiring campaigns.
A finance assistant working on one business unit should only receive the accounts and records available to that role.
A software incident assistant may need access to several connected services, without receiving information about every system in the organisation.
Smaller working sets make those boundaries easier to express.
An active hiring campaign or reporting cycle becomes cold once it closes, while confirmed outcomes may remain warm organisational knowledge.
Context Is a Working Set
Context Temperature led me towards another familiar computing concept: the “working set”.
- Operating systems do not load every file into memory.
- Databases do not keep every page in cache.
- Spark does not persist every dataset.
Each system tries to keep the information most likely to be needed close to the process using it.
Context graphs can be designed in a similar way.
As the context moves closer to the task, it becomes smaller and hotter.
The enterprise layer can hold broad relationships and durable knowledge.
The operational layer brings together the information needed by a programme, campaign or service.
The investigation or team layer narrows the scope further.
The task layer contains the immediate working set.
The agent may then select a final portion to place into its prompt or tool calls — which is how multi-agent systems stay useful without drowning every worker in enterprise noise.
This hierarchy helps with more than performance.
It provides boundaries for:
- Security
- Cost
- Data minimisation
- Auditability
- Retention
- Relevance
- Human review
A recruitment assistant reviewing one vacancy should not receive interview notes from unrelated hiring campaigns.
A finance assistant working on one business unit should only receive the accounts and records available to that role.
A software incident assistant may need access to several connected services, without receiving information about every system in the organisation.
Whilst smaller working sets make those boundaries easier to express, there is still a risk of creating too many copies.
If every user, team and agent owns a permanent graph, synchronisation quickly becomes difficult. The organisation may end up with thousands of partially stale versions of the same facts.
The layers should therefore be treated as a logical model first.
Some may become physical graphs. Others may be filtered views, cached traversals or temporary structures assembled when needed — a mixed approach you also see when building agentic applications on data platforms.
Positioning Different Scenarios
The three dimensions help explain why similar-looking use cases can need different architectures. It does not select the technology, but it can help narrow the questions.
- A large, long-lived, mostly warm graph needs durable storage, governance and incremental maintenance.
- A small, short-lived, hot graph may be assembled on demand and discarded afterwards.
- A long-lived, tightly isolated graph may need its own physical boundary.
- A fast-moving operational graph may need event-driven updates.
Where This Leads
Copying everything into one graph may work for a bounded recruitment domain with predictable volume and relatively stable relationships.
Incremental copying may suit a hiring campaign that needs current application, scheduling and interview status.
On-demand assembly may suit a finance review where the relevant scope emerges from an unexplained variance.
Federated access may be preferable where candidate documents, payroll data or detailed financial records should remain in their source systems.
Federated access may be safer where data cannot be moved or duplicated freely.
The next article looks at those approaches directly:
- Full copies
- Incremental updates
- Batch synchronisation
- On-demand context
- Federated queries
- Derived knowledge and feedback into source systems
Neo4j, Neptune, streaming platforms, lakehouses and agent frameworks can all support several of these patterns.
The usage model gives the architecture its shape — which is also the heart of our philosophy: understand the work and the boundaries first; then choose the stack.
Before choosing how to build the graph, I would want to understand the work it will support, how long that work lasts, and which information is likely to become hot — whether you operate in FinTech, cyber, utilities, or any other sector where connected organisational knowledge has to stay relevant and governable.
If you are designing context layers for agentic workflows, get in touch.