In software, estimating is controversial. Developers are afraid of being held to impossible deadlines, and managers are afraid of situations where they can’t forecast (and therefore can’t plan.)
Blanket rejection of or insistence on estimating is too stubborn. Instead, you should focus on the situational evidence for and against estimating in your context, and pragmatically adjust based on what you learn. In this post, we’ll look at how to measure the quality of your estimates, and what to do when it doesn’t stack up.
What is estimating?
Estimating is when a team tries to figure out the size of a piece of work before starting the work. Different frameworks and teams will mean different things by size: time, complexity, novelty, etc. The theory is that if you assign a size to the pieces of work in your backlog, you should be able to do some forecasting and give your stakeholders a better idea of when they can expect to receive the value you are looking to deliver.
Estimates are sometimes measured literally, in days or hours, and sometimes measured relative to other pieces of work (e.g. “This task is twice as big as that task”.) Teams who estimate with a relative measure often choose an abstract way to represent size, such as t-shirt sizes (small, medium, large) or “story points” (1, 2, 3, 4.) Endless variation on this is possible, many teams choose to use the Fibonacci sequence to represent the available options for estimating — a sensible compromise that recognises that the fidelity of an estimate is likely to decrease with its size.
Teams that estimate often use some variation on “Planning Poker” – a ceremony where tasks are described, discussed, and team members give their estimates simultaneously to avoid being heavily influenced by each other. Outlier estimates are discussed, and a number is recorded against the upcoming task.
There are plenty of reasons why teams might not estimate at all. It could be because they just haven’t got round to it yet, because they don’t believe that their estimation sessions were producing accurate data, because their task size is mostly consistent, or because their stakeholders and organisations don’t require forecasting.
Measuring the accuracy of your estimates
I’ve worked with many teams who have chosen not to estimate, a common scenario I see is this:
The team is not estimating, and maybe not attempting to forecast. A new senior person joins the team: either as a stakeholder, a technical lead, a delivery manager, or a senior engineer. They are used to teams producing estimates, and have seen them used effectively in previous teams. They persuade the team to adopt estimating. Now burnup charts are produced, likely completion dates can be broadcast to stakeholders, and the team has a new meeting in the diary each fortnight to produce estimates. Several iterations pass. So what’s the problem? The team has no idea if it is working.
Giving numbers and dates to stakeholders feels like a mitigation of risk. After all, if you spot that you are going to miss an important date early on based on your estimates, you can act to change course, or give stakeholders fair warning about what to expect.
However, if you don’t have evidence that your numbers are accurate, you have massively increased risk. Sharing inaccurate data means that people will make bad decisions — false certainty destroys value.
Checking for accuracy
Before you do this, have an honest conversation about what an estimate is for. In my experience, the biggest motivator for producing estimates is forecasting: telling stakeholders what is likely to be ready by what date. Sometimes it is also used for cost benefit analysis of an upcoming feature. The thing these have in common is time: If your estimation process produces reliable indicators for the time it takes to do some work, your stakeholders will make better decisions.
This means that you need to decide what you are going to benchmark your estimates against. Figure out how to measure Lead Time across your process, and make sure that measure is broad enough to capture time that the task spends in queues, analysis, testing, etc.
It’s important to note here that if you aren’t using literal time as the basis of your estimation, then the thing we actually care about is consistency. Obviously we can’t truly say that we accurately estimated something to be “Medium” or “4 points”, because those are abstract measurements, only meaningful in relation to each other. We just care that “4 points” means roughly the same thing each time we see it.
Next, pick an evaluation period. This needs to be long enough to cover a good range of the types of tasks that your team does. About a month often feels right. During this period, estimate all of your tasks and record the lead time for each of them. If you are using project management software, it will probably help you get this number automatically. You don’t need to overcomplicate things – it works just as well to add a small dot or sticker to each card on your story wall at every standup until it gets to Done, then count the dots.
Next, plot the actual times taken on a stacked bar chart, and see how they stack up against your estimates. If things are going well, you’ll see something like this
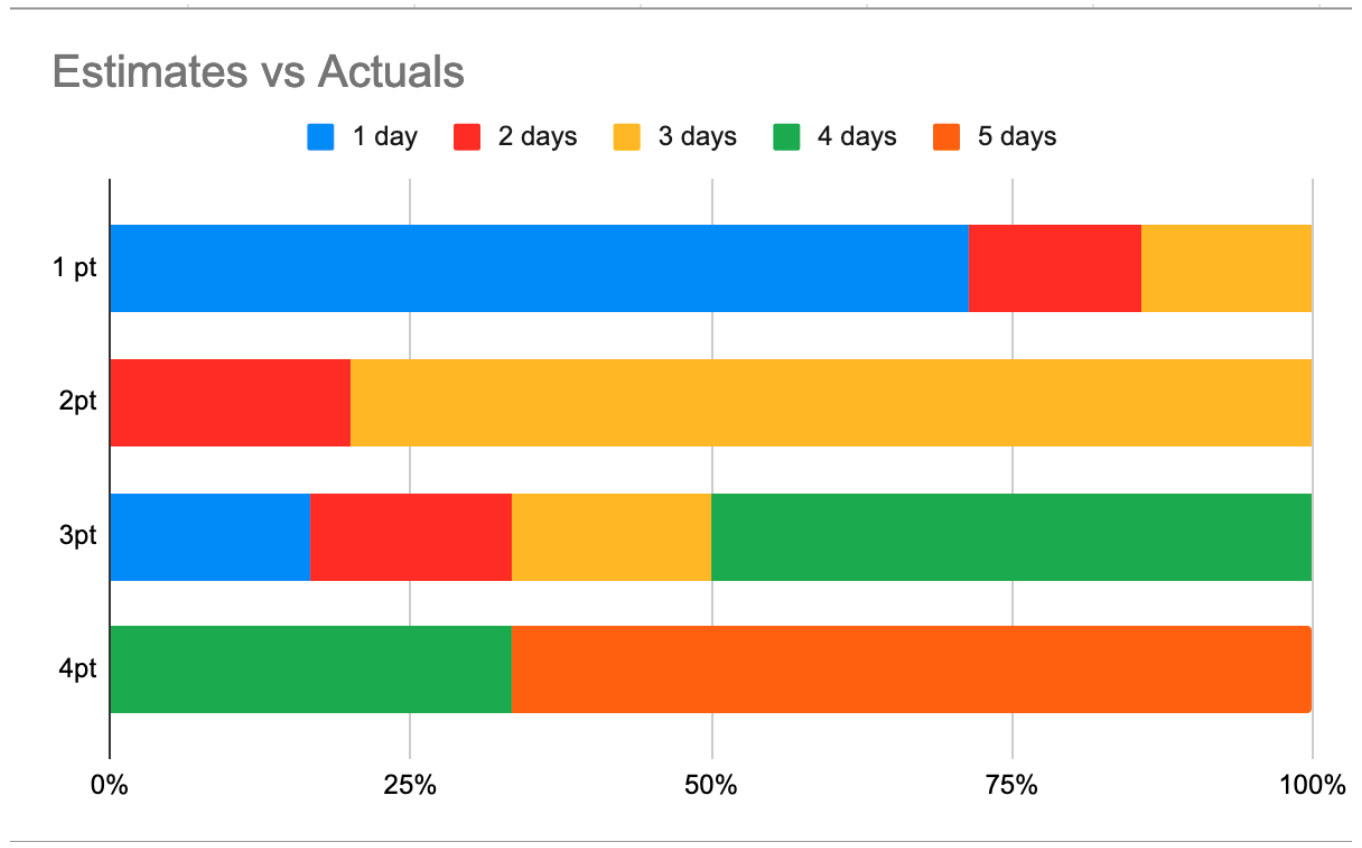
This chart shows that of the stories assigned “1 point” in estimation, 75% were completed in one day. Similarly, around 80% of the stories assigned “2 points” in estimation were completed in 3 days. This tells us that for any story that the team gives “2 points” during estimation, we can be pretty sure it will be completed within 3 days.
In this example, our 3 point estimates are a little more shaky. It’s most likely that stories assigned “3 points” by the team will be completed in 4 days – but even though that is the most likely outcome, it’s only true 50% of the time. Still, most of the data is tight enough that you could do some forecasting.
Here’s what it looks like when your estimates aren’t consistent.
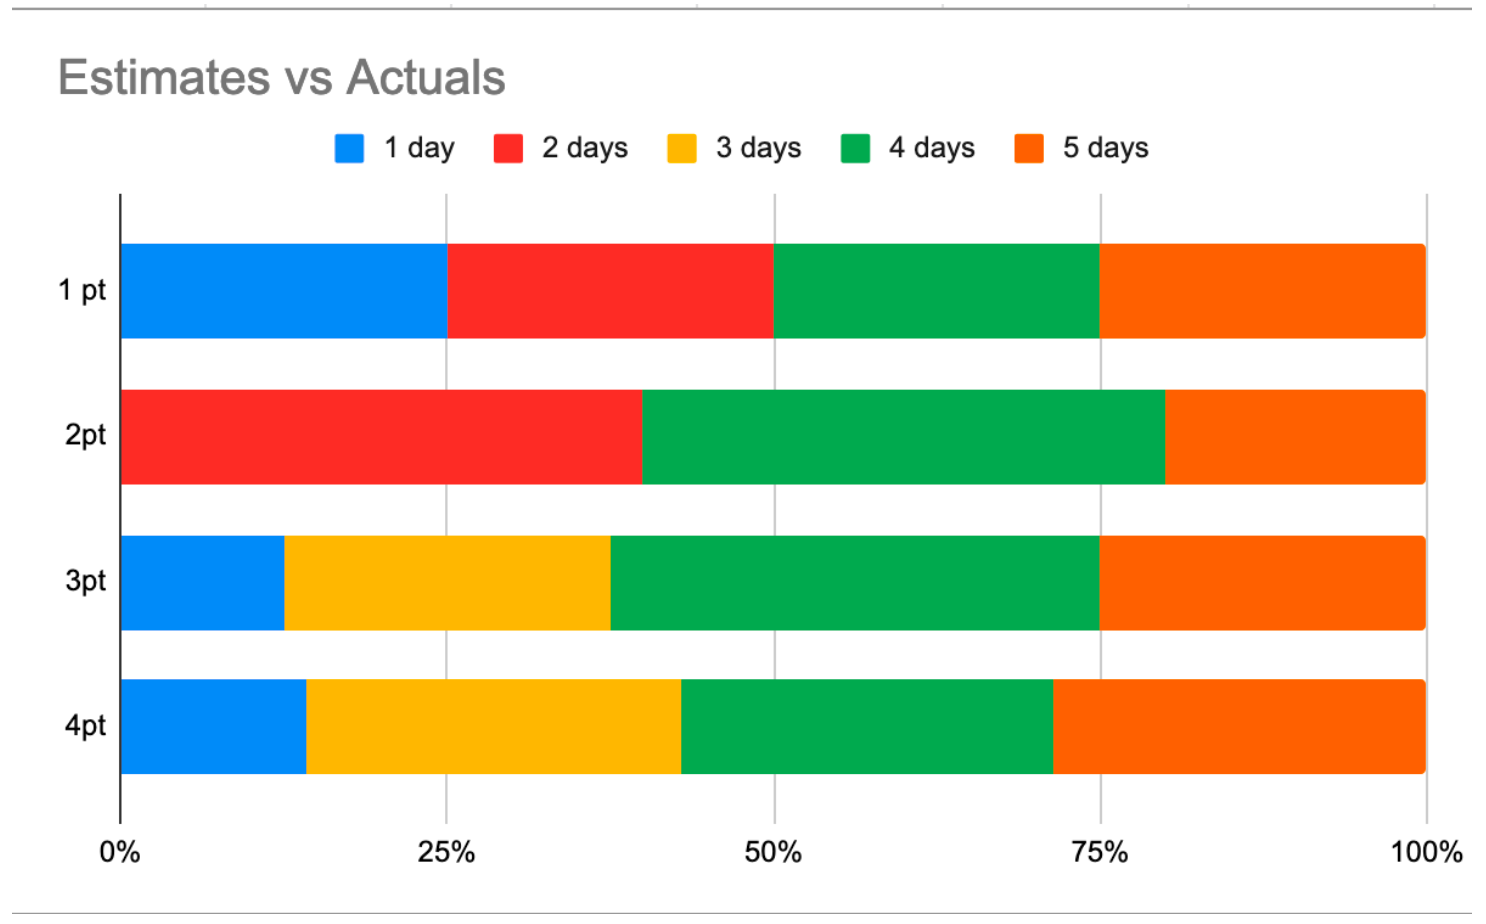
In this example, a story assigned “1 point” by the team is equally likely to take 1, 2, 4 or 5 days to complete. Stories assigned 3 or 4 points by the team have an almost identical profile. It’s hard to describe probability in a way that makes sense to human beings – so if you need a takeaway message from the above graph it is this: It would have been just as accurate to assign our estimates using a random number generator.
In my experience, most teams that have never measured their estimates are in a position like this. Estimating consistently is really hard when part of what you are doing is solving puzzles. Unless your task is simple and something you’ve done before, then estimating the size of it is like estimating how long it will take you to complete a cryptic crossword.
At this point you need to make a decision between trying to bring up the consistency of your estimates, or communicating to your stakeholders that you are no longer going to estimate. The one thing you should not do is continue forecasting with your dodgy data. As with all investments, if you choose to work on improving your estimation practises, think about what value it will give you and how much work it is worth doing to achieve it.
Factors that influence accuracy
- Domain – Some domains are just more complicated than others. I’ve worked on teams where every new task starts with getting a professional opinion on the interpretation of a piece of legislation, estimating was pointless in this situation.
- Team maturity – The more times your team has “just added another rule”, or “just exposed a new piece of data on the API”, the more likely it is that they’ll be able to benchmark it consistently.
- Tech stack – Do you need to add a new library or framework to achieve this task? That adds a lot of uncertainty.
- Project phase – The early stages of development of a new product have more uncertainty than later, business-as-usual phases. If it is the very first time you have added an authenticated user session, for example, then you are going to need to do some learning, some puzzle solving, and some troubleshooting; this will be much harder to benchmark.
- Team wellbeing – Don’t be surprised if an unexpected event harms your consistency. For example, have you measured how your estimates changed when everyone transitioned from a co-located team to a remote team because of the COVID-19 pandemic? Are stakeholders putting extra pressure on your team because of a crisis elsewhere in the business? Estimates are made by humans, and so changes in team wellbeing will be reflected.
- Safety – This should go without saying, but if you incentivise your team to meet estimates, either through rewards or reprimands, your team will always estimate too high. If you get angry when your team tells you something will take longer than you are hoping for, your team will hide that data from you. Don’t be that person.
Communicate certainty openly
Most people agree with this in theory, but many find themselves in organisations where they aren’t actually empowered to change the way their team interfaces with stakeholders. In this situation, stakeholders might demand estimates for the sake of consistency between teams, regardless of the unique situation your team is in. When this happens, just make sure you always give the data about certainty alongside the estimates.
For example: “Based on what we know about our estimation data, this epic is equally likely to take 10 or 90 days”, or “We gave this a 4, which in practice is the same as a 2, 3 or a 5”. This might sound facetious, but it’s reckless to communicate certainty when you have none.
So should you be estimating? Maybe, but you should make that call with all of the evidence in front of you.
If you are interested in reading more from our blog, you can visit us online here.